IT systems and infrastructure specialist with experience in networking, servers, CMS/WordPress, hosting, security, virtualization, and technical troubleshooting.
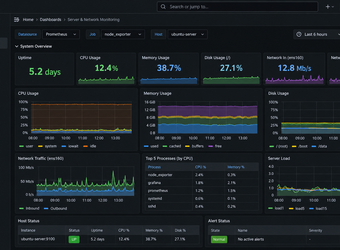
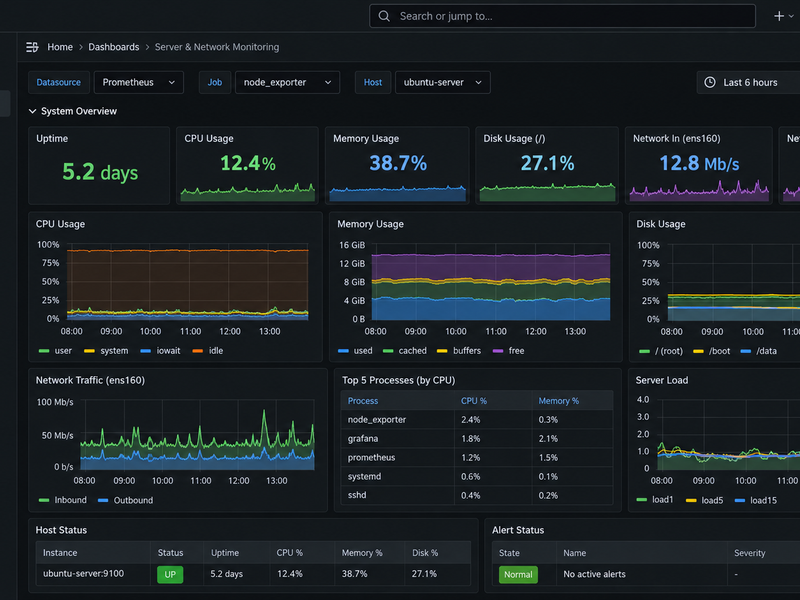
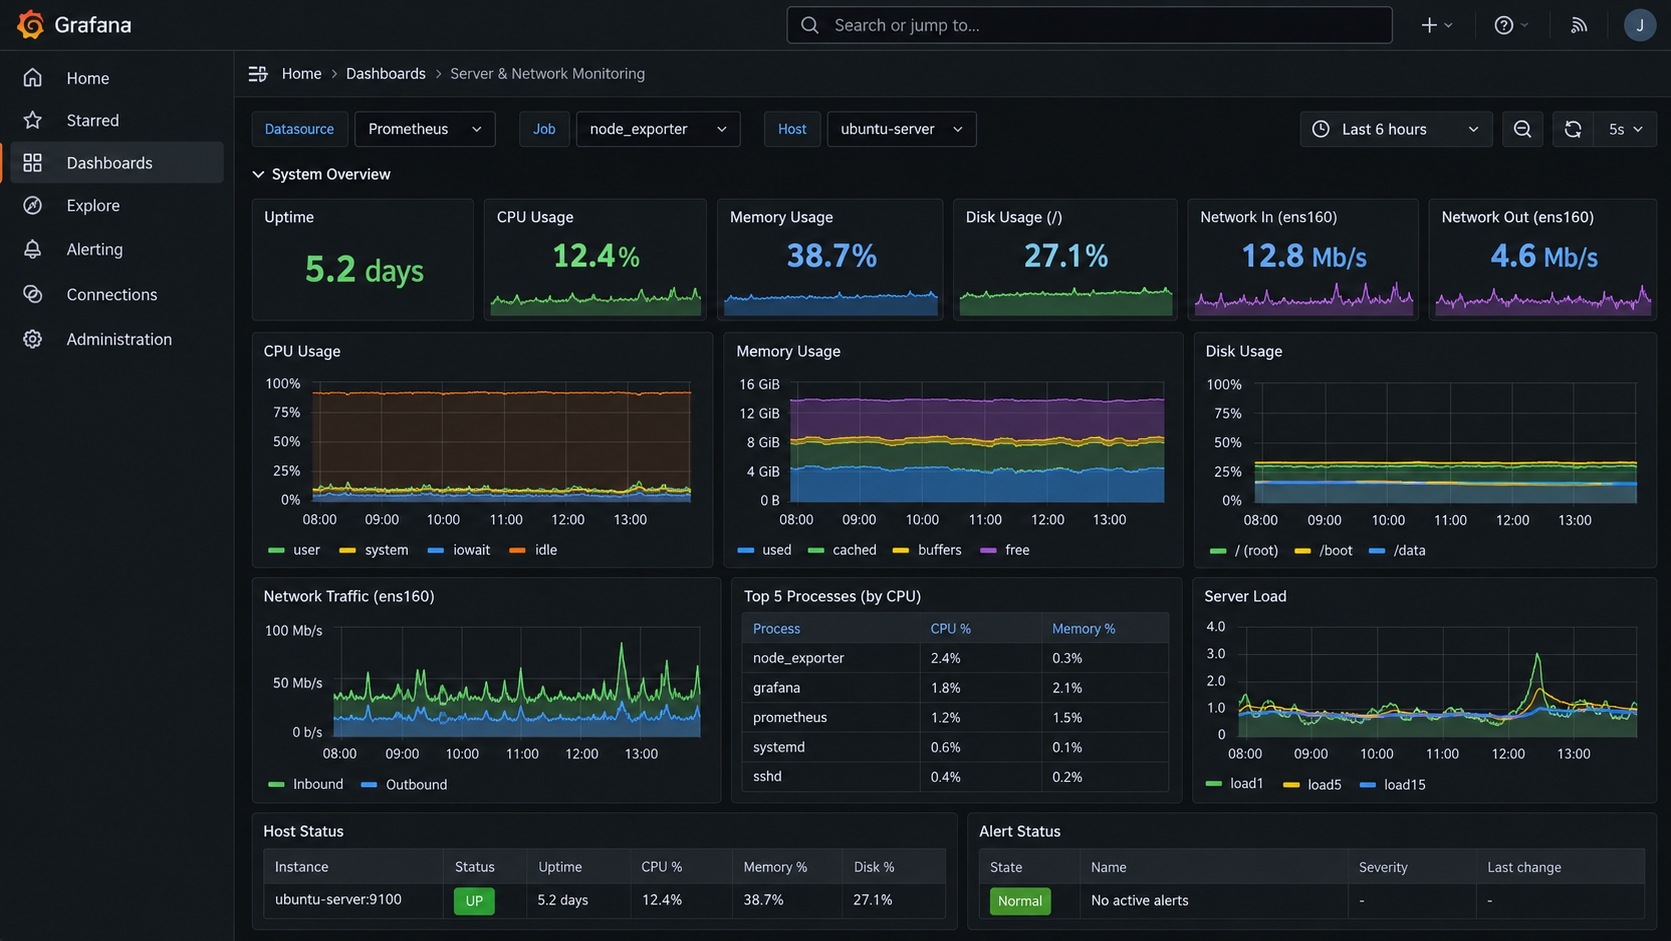
Centralized monitoring of server health, network traffic, system resources, uptime, and performance trends through dashboard-based infrastructure visibility.
Monitoring provides visibility into the health and performance of systems before issues become service interruptions. This project demonstrates centralized tracking of server resources, network traffic, system load, disk utilization, uptime, and service status through a dashboard designed for quick operational awareness.
System Health Monitoring
CPU, memory, disk utilization, system load, uptime, and active services can be monitored from a centralized dashboard to help identify resource pressure, abnormal activity, or degraded system performance.
Network Performance Visibility
Network traffic metrics provide insight into inbound and outbound utilization, interface activity, throughput, and usage trends over time. This visibility helps support troubleshooting and capacity planning.
Alerts & Operational Awareness
Dashboard status indicators and alerting provide a fast way to identify systems or services requiring attention. Centralized monitoring reduces the need to check individual hosts and creates a clearer view of overall infrastructure health.
Grafana Infrastructure Monitoring — Server uptime, CPU, memory, disk usage, network traffic, system load, process activity, host status, and alert visibility from a centralized monitoring interface.
Effective monitoring connects server and network metrics into a single operational view, making it easier to identify trends, investigate performance issues, and respond to system conditions before they affect users. Centralized dashboards also provide a more consistent way to track the health of multiple systems over time.
Firewall administration and network security across multiple platforms, including traffic policies, segmentation, VPN connectivity, monitoring, and security visibility.
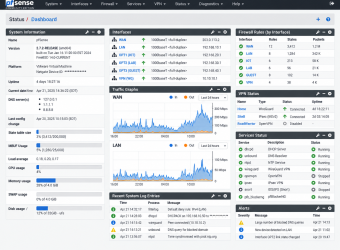
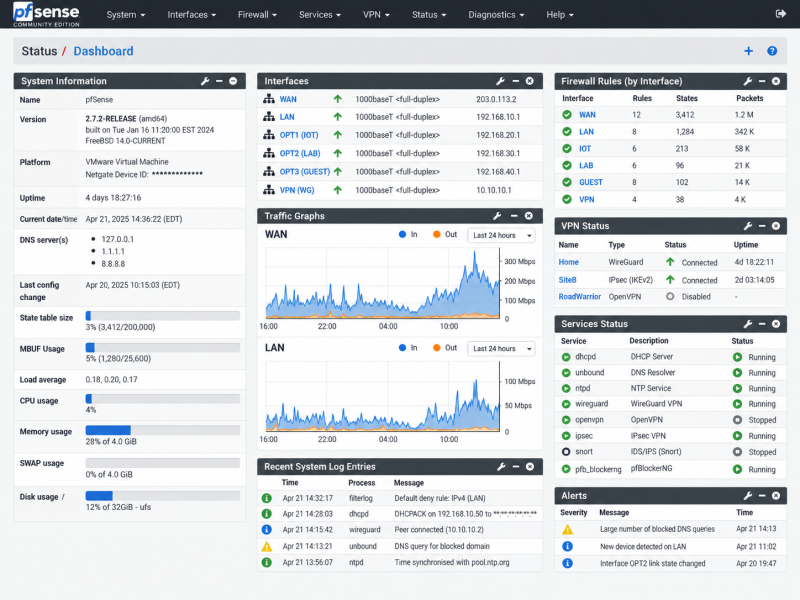
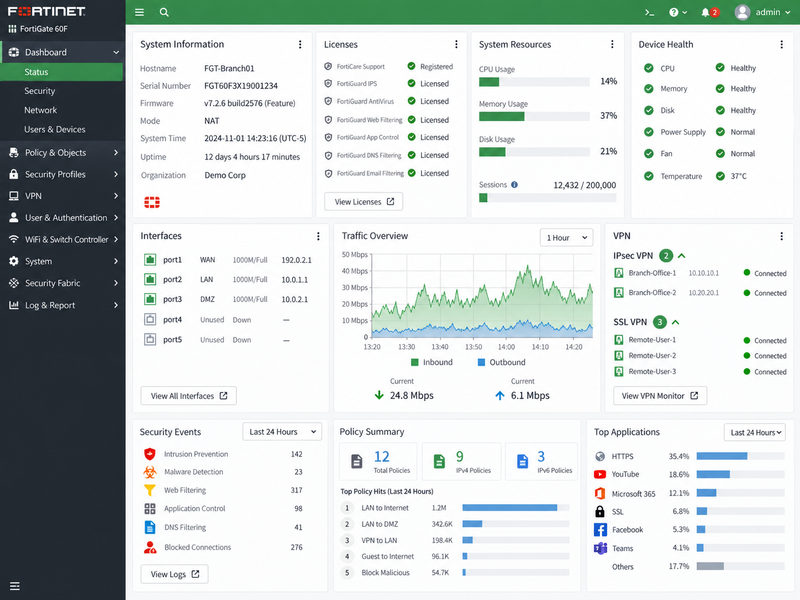
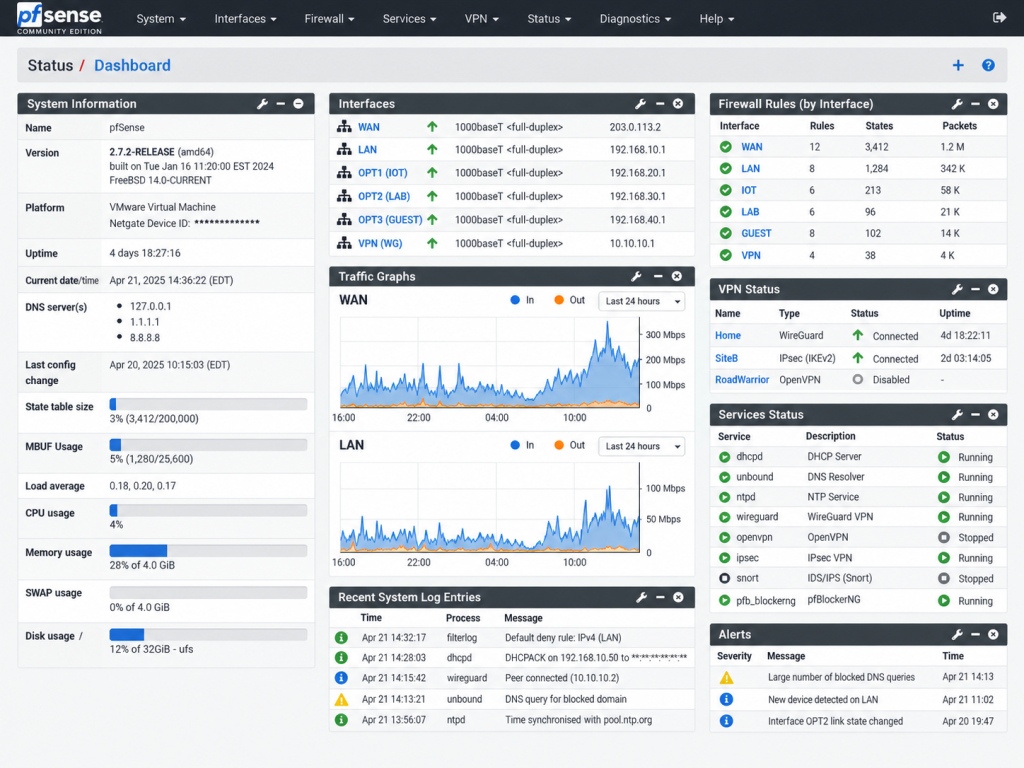
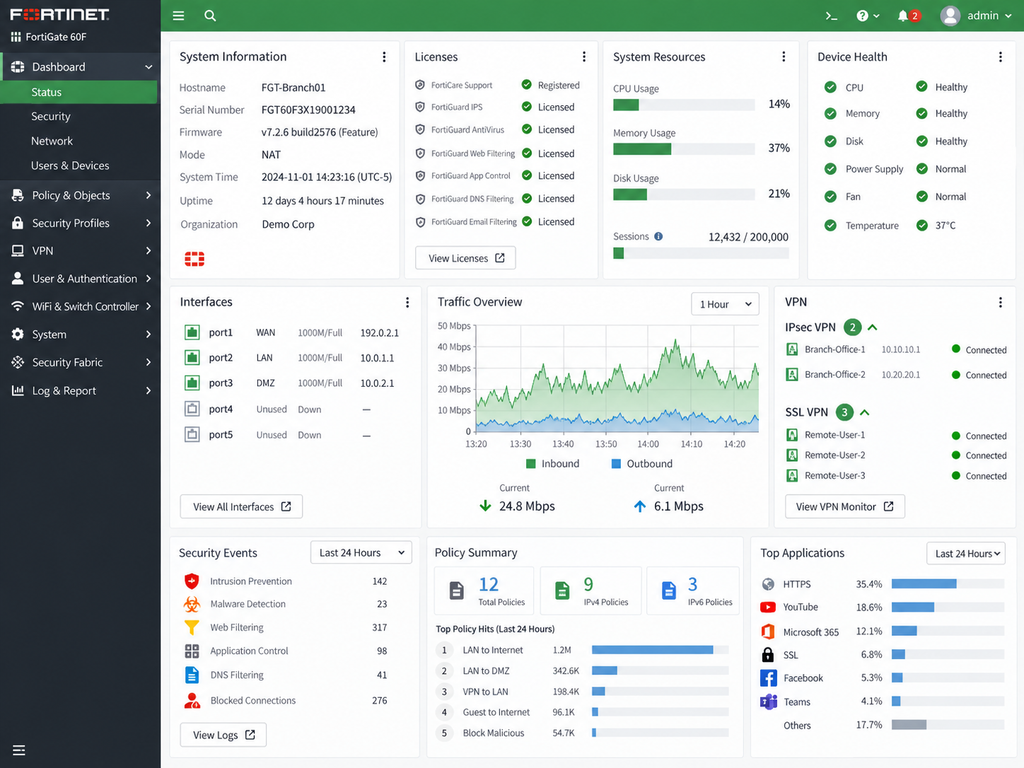
Firewall management is a core part of maintaining a secure and reliable network environment. This project highlights administration across pfSense and FortiGate platforms, including interface management, traffic policies, VPN connectivity, network segmentation, system health, and security monitoring.
Firewall Policy & Segmentation
Firewall rules and network interfaces are organized to control traffic between internal networks, internet-facing services, VPN users, and isolated segments. Clear policy structure helps reduce unnecessary access while maintaining reliable connectivity.
VPN & Secure Access
VPN services provide protected connectivity for remote users and site-to-site communication. Monitoring tunnel status, authentication, routing, and access policies helps maintain dependable and secure remote access.
Security Monitoring
Firewall dashboards provide visibility into traffic, blocked connections, system resources, security events, application activity, and network health. This information supports troubleshooting and helps identify unusual or potentially unwanted activity.
Working with different firewall platforms reinforces the underlying concepts of policy-based access control, segmentation, routing, VPN connectivity, and network monitoring. Familiarity with multiple interfaces also makes it easier to adapt to existing security infrastructure and troubleshoot mixed-vendor environments.
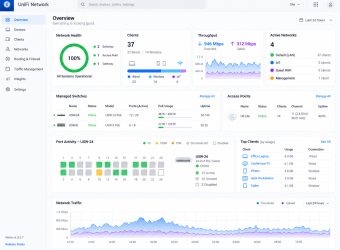
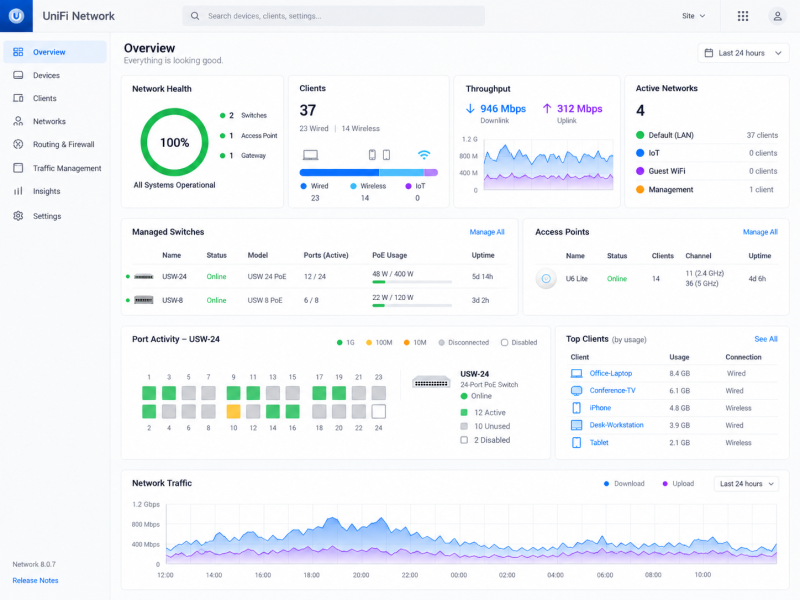
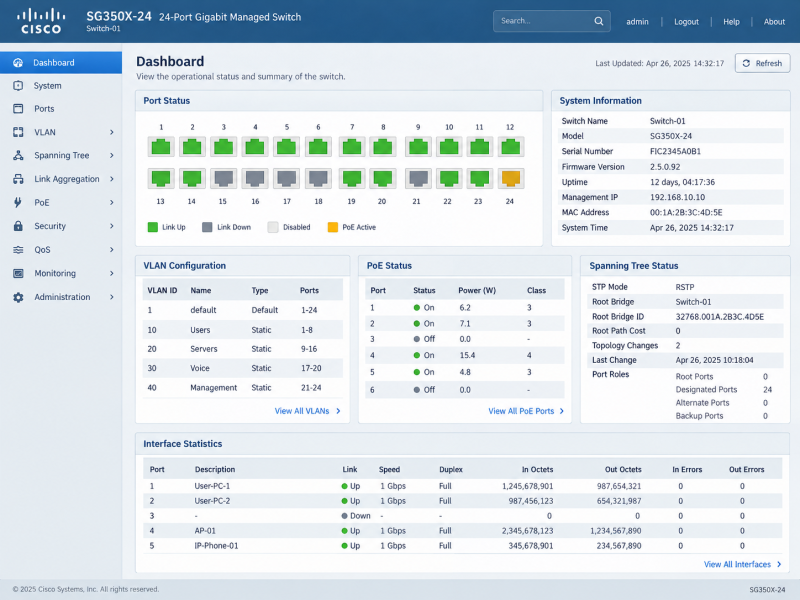
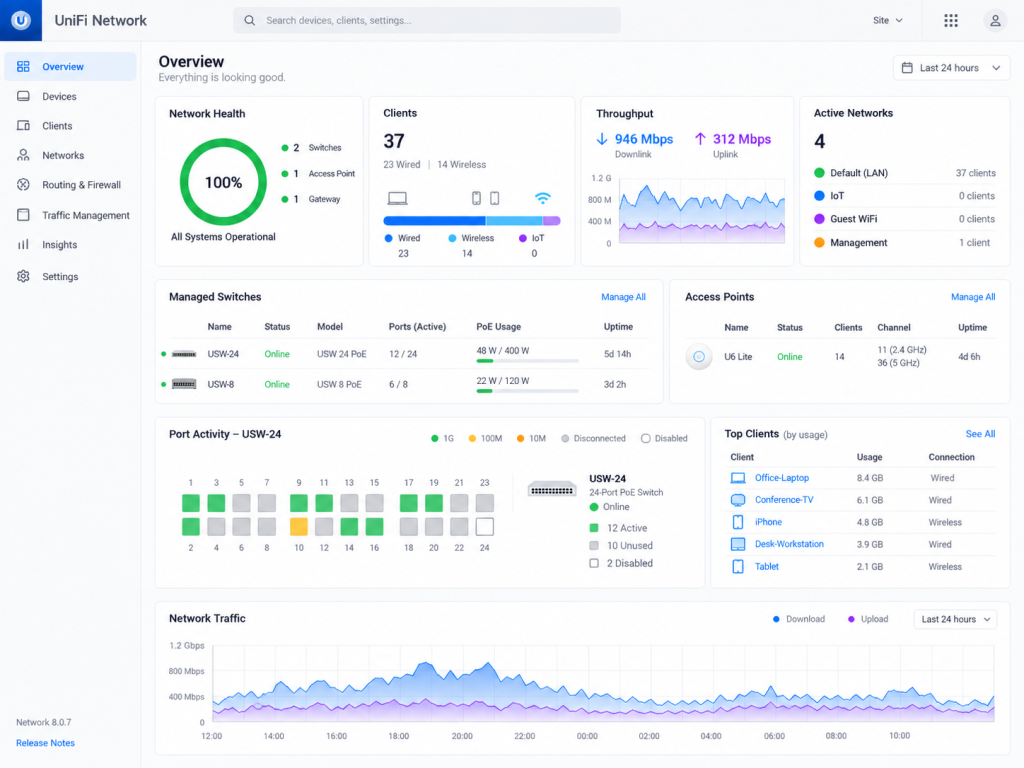
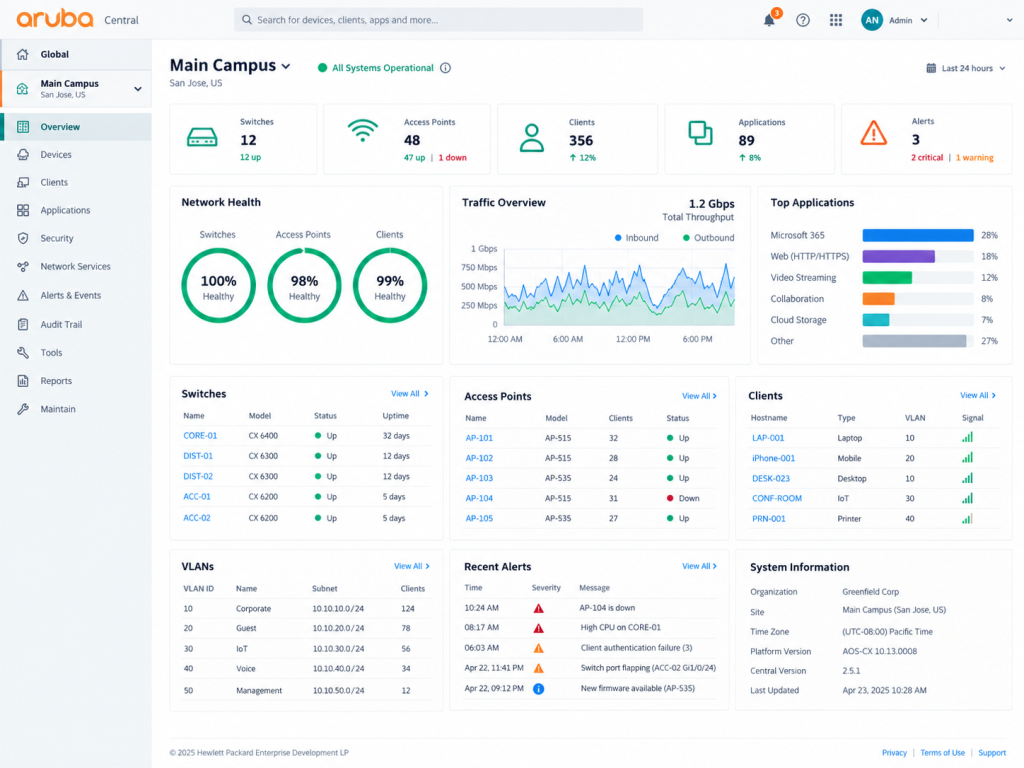
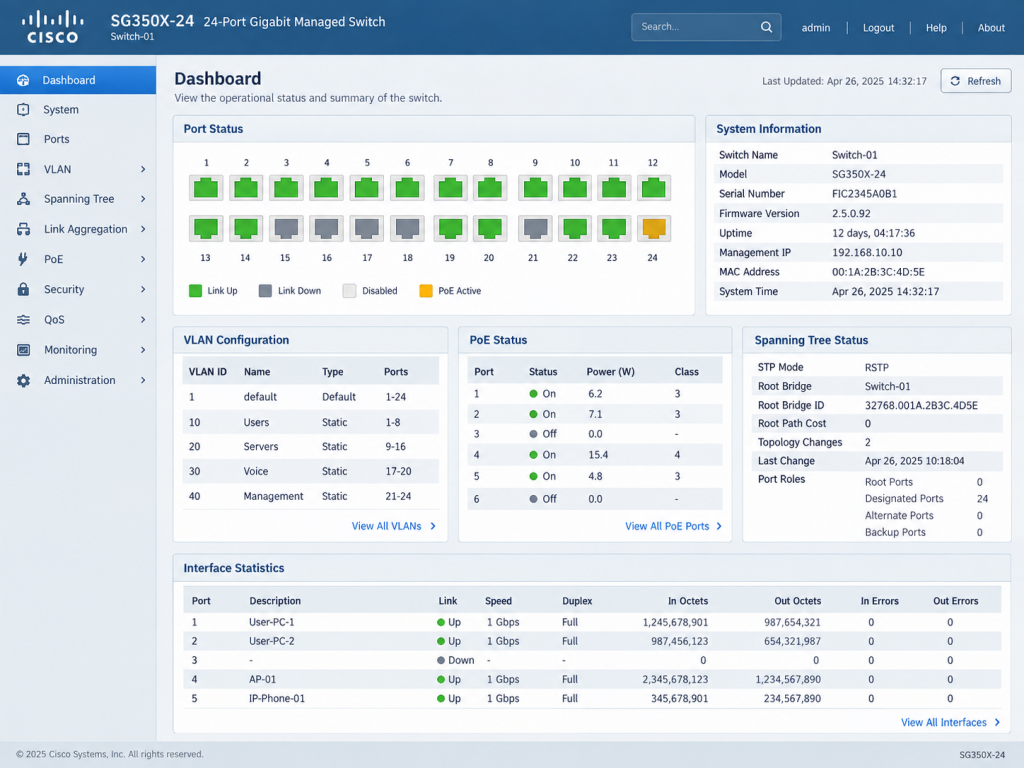
Modern network environments often combine equipment from multiple vendors, each with different management tools and workflows. This project highlights experience working across managed network platforms to organize switching, wireless access, VLANs, connected devices, PoE resources, and overall network health from centralized administration interfaces.
Network Architecture
Network infrastructure is organized around clear device roles, logical segmentation, and reliable connectivity between users, servers, wireless systems, and network services. Centralized management provides visibility into device health, connected clients, traffic, and infrastructure status.
Switching & Segmentation
Managed switching supports VLAN configuration, port administration, PoE devices, uplinks, and separation of traffic across user, voice, server, wireless, and management networks. These controls help maintain an organized and manageable network environment.
Monitoring & Troubleshooting
Network dashboards provide real-time insight into switches, access points, connected clients, interface utilization, alerts, and performance trends. This visibility helps identify connectivity issues, overloaded interfaces, offline devices, and other conditions requiring attention.
Centralized switching, wireless, client, and network-health visibility through the UniFi management interface.Multi-device monitoring of switches, wireless access points, clients, VLANs, traffic, and infrastructure alerts.Switch-level administration including ports, VLAN configuration, PoE, spanning tree, and interface statistics.
Working across different network platforms requires understanding the underlying networking concepts rather than relying on a single vendor interface. Familiarity with multiple management environments makes it easier to adapt to existing infrastructure, troubleshoot mixed-vendor networks, and support technology as organizational needs change.