
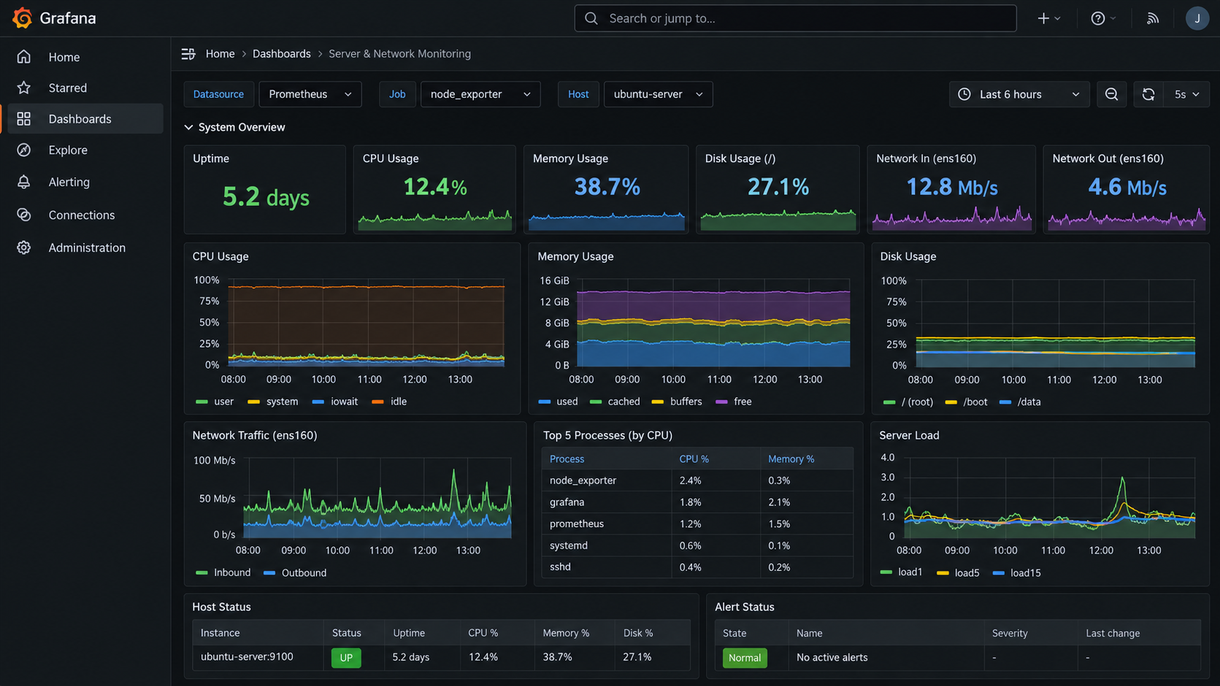
Infrastructure Monitoring & Performance
Centralized monitoring of server health, network traffic, system resources, uptime, and performance trends through dashboard-based infrastructure visibility.
- Environment Lab / Demonstration Environment
- Scope Infrastructure & Performance Monitoring
- Platforms Grafana · Prometheus · Node Exporter
- Focus Metrics · Uptime · Traffic · Alerts
Monitoring provides visibility into the health and performance of systems before issues become service interruptions. This project demonstrates centralized tracking of server resources, network traffic, system load, disk utilization, uptime, and service status through a dashboard designed for quick operational awareness.
System Health Monitoring
CPU, memory, disk utilization, system load, uptime, and active services can be monitored from a centralized dashboard to help identify resource pressure, abnormal activity, or degraded system performance.
Network Performance Visibility
Network traffic metrics provide insight into inbound and outbound utilization, interface activity, throughput, and usage trends over time. This visibility helps support troubleshooting and capacity planning.
Alerts & Operational Awareness
Dashboard status indicators and alerting provide a fast way to identify systems or services requiring attention. Centralized monitoring reduces the need to check individual hosts and creates a clearer view of overall infrastructure health.
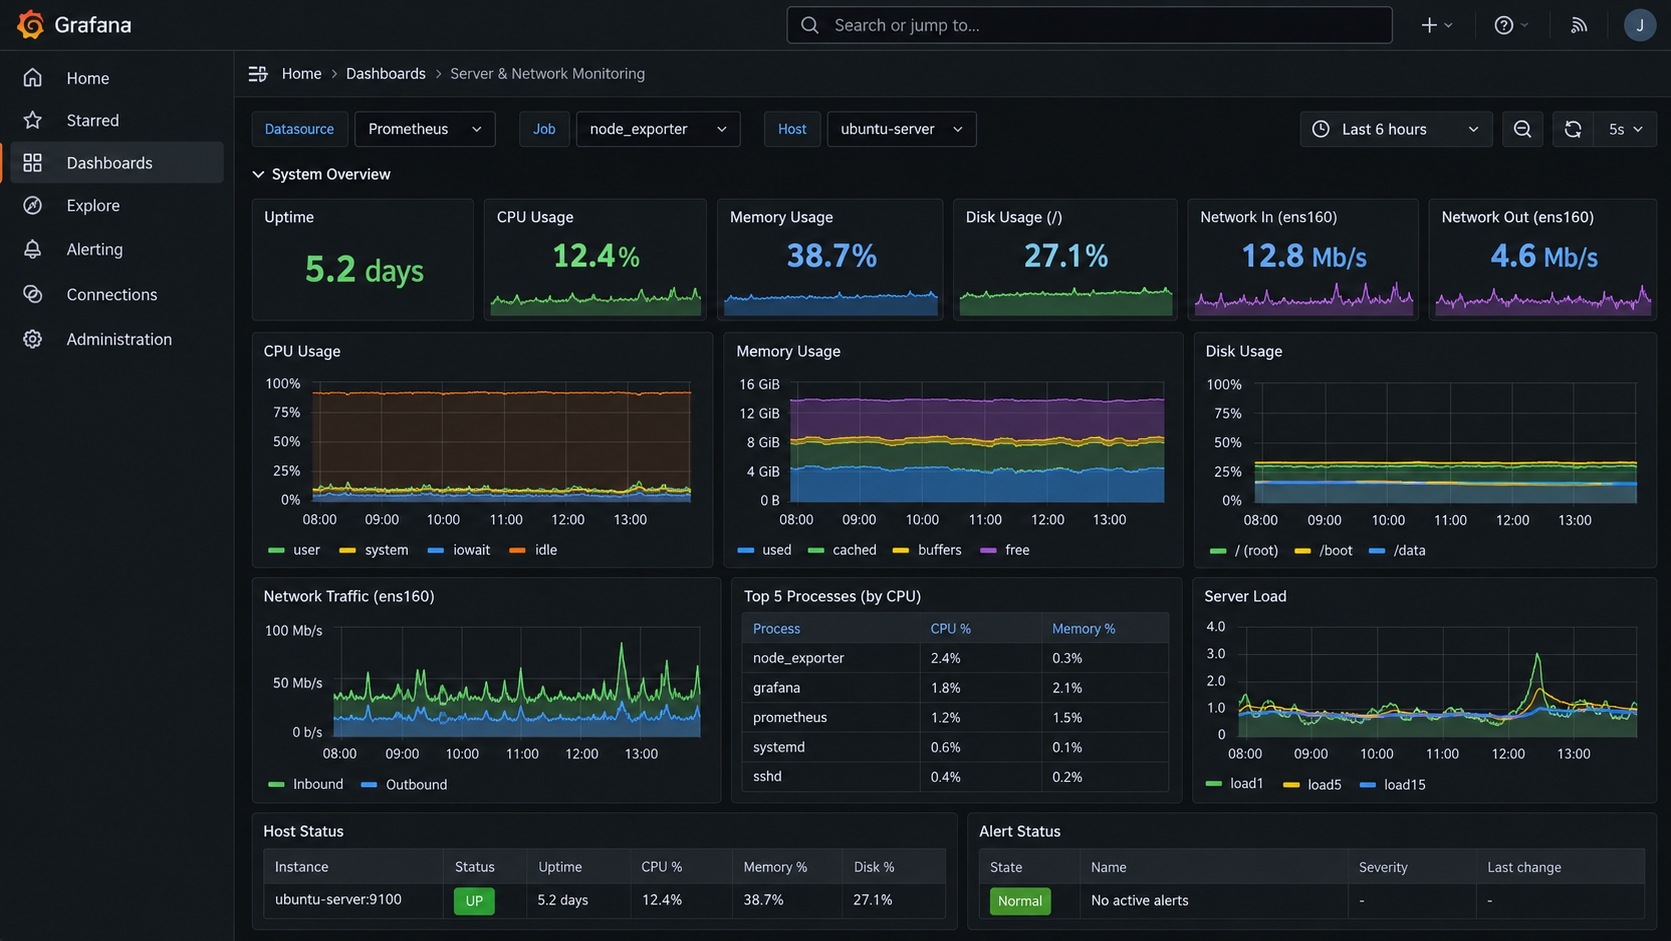
Effective monitoring connects server and network metrics into a single operational view, making it easier to identify trends, investigate performance issues, and respond to system conditions before they affect users. Centralized dashboards also provide a more consistent way to track the health of multiple systems over time.